Do it yourself models of the evolution of cooperation.
We've all been there. You've tried and you've tried but no matter what you do, it doesn't get better. At some point you have to just face the facts and walk away. It's not good, it's not going to get any better, and you have better options out there in the wide, wide world. Being able to recognize when it's time to walk away is an important skill. Not just for us as humans, but also for other animals and even for the simplest unicellular life forms.
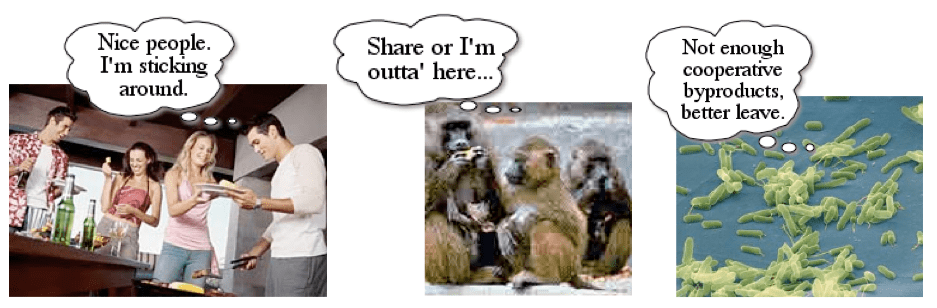
The ability to recognize when things aren't good and leave is a very simple way of protecting yourself. But it is more than that. When individuals can walk away from uncooperative partners and groups, this can actually shape the trajectory of evolution itself, leading to more cooperators in the population in the long term.
How does this work? The Walk Away strategy is a very simple (probably the most simple) partner choice rule. Partner choice is one route to the evolution of cooperation. When individuals have the ability to decide who they will interact with (or continue to interact with), this leads to positive assortment. Positive assortment means that the population is 'sorting' into different types more often than would be expected by chance. In other words, cooperators end up interacting with cooperators more than they interact with others; and so the benefits of cooperation are bestowed upon cooperators more often than exploiters. Exploiters may benefit in the short term from some interactions with cooperators, but once they are 'found out,' they lose their cooperative partner. Exploiters end up spending more time alone, while cooperators end up spending more time in cooperative and productive partnerships or groups.
For example, in the figure below we can see the payoffs for cooperators (blue) and exploiters (red) in a spatial version of the Prisoner's Dilemma game where individuals use the Walk Away strategy. We can see that pairs of cooperators are stable, pairs with exploiters are not, and exploiters are more likely to be alone than cooperators.

This means that cooperation can have a higher payoff than defection and that cooperators can increase in frequency in the population. So, walking away is more than just a good way of protecting yourself from being exploited, it is actually a way of taking the evolution of cooperation into your own hands (or feet, I suppose).
In my 2004 Journal of Theoretical Biology paper, I showed that the Walk Away strategy can outperform Tit-for-Tat and other strategies in a spatial version of the Prisoner's Dilemma and that Walk Away can invade a population of exploiters with very few initially cooperative individuals (compared to Tit-for-Tat which requires more cooperators to invade a population of exploiters). You can read more about the Walk Away strategy in the Prisoner's Dilemma in my paper (link below).
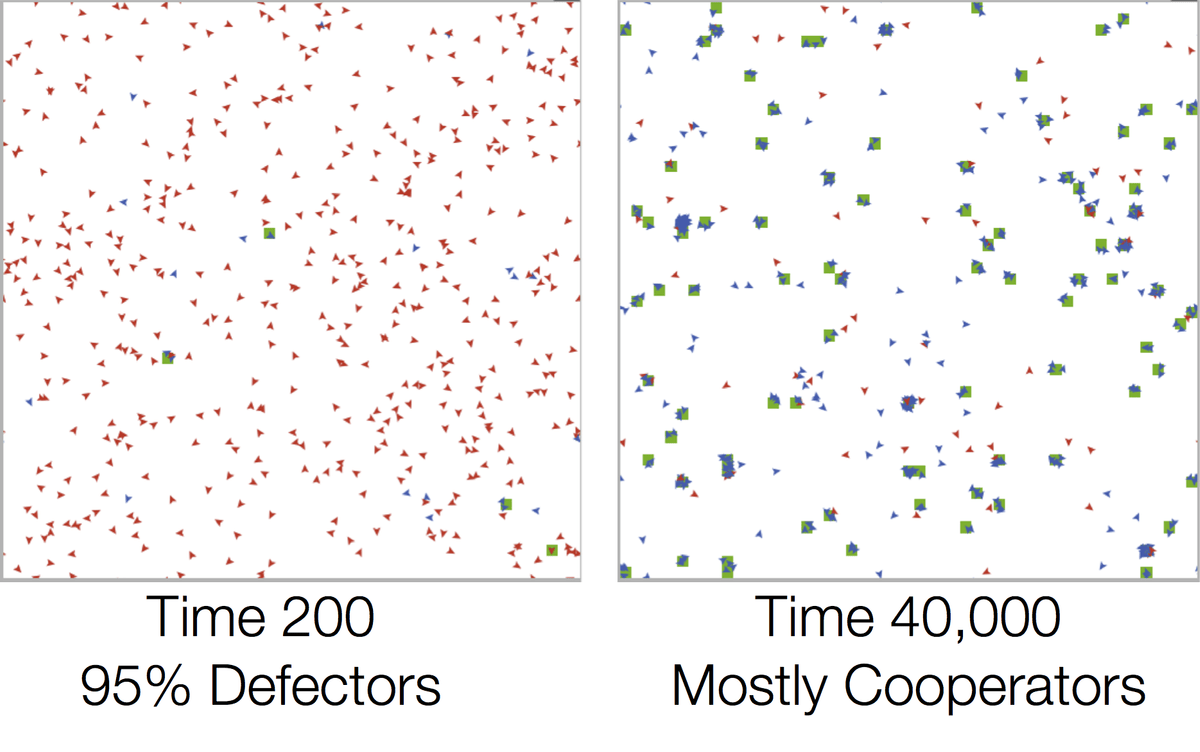
Walk Away can also be implemented in a group context, where individuals leave groups that are not cooperative enough. This leads to a similar situation where groups with cooperators are more stable and long lasting than groups with exploiters. Groups of cooperators can also grow larger than groups of defectors. Because cooperators get the benefits of being near cooperators more than exploiters do, cooperation can increase in the population. The screen shot below shows how the composition of the population and the structure of the population changes over time. Note how the proportion of cooperators (blue triangles) goes up and the number of exploiters (red) goes down from the beginning of the simulation (left) to the end (right). Also, you can see how the population goes from having just a few small groups (denoted by green patches underneath the agents) to have more and larger groups at the end.
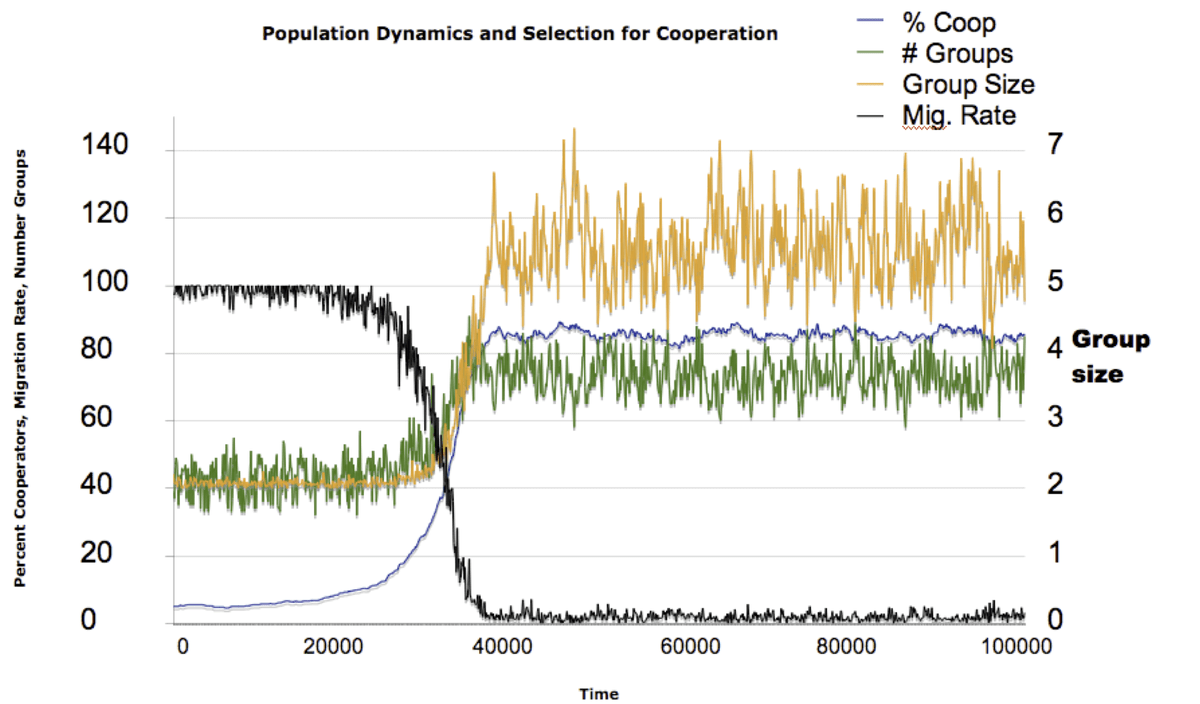
Another way to look at how the population changes over time is to plot cooperation (blue), group size (yellow), number of groups (green) and also migration rate (black) over time. You can see from the figure below that there is a critical transition that occurs when cooperation in population starts to increase. From that point forward the world is a different place, with less movement between groups, larger groups and more groups. It's tempting to look at this kind of transition as something like a transition from simply a population of individuals to a society (or at least some sort of proto-society).
If you want to try it for yourself, you can download the model through the OpenABM website by clicking on the button below and open it using version 4.1 of the NetLogo agent-based modeling program (free at https://ccl.northwestern.edu/netlogo/). You can alter the parameters on the sliders and explore the limits of the model, or use it as a starting point for asking your own questions about the evolution of cooperation.
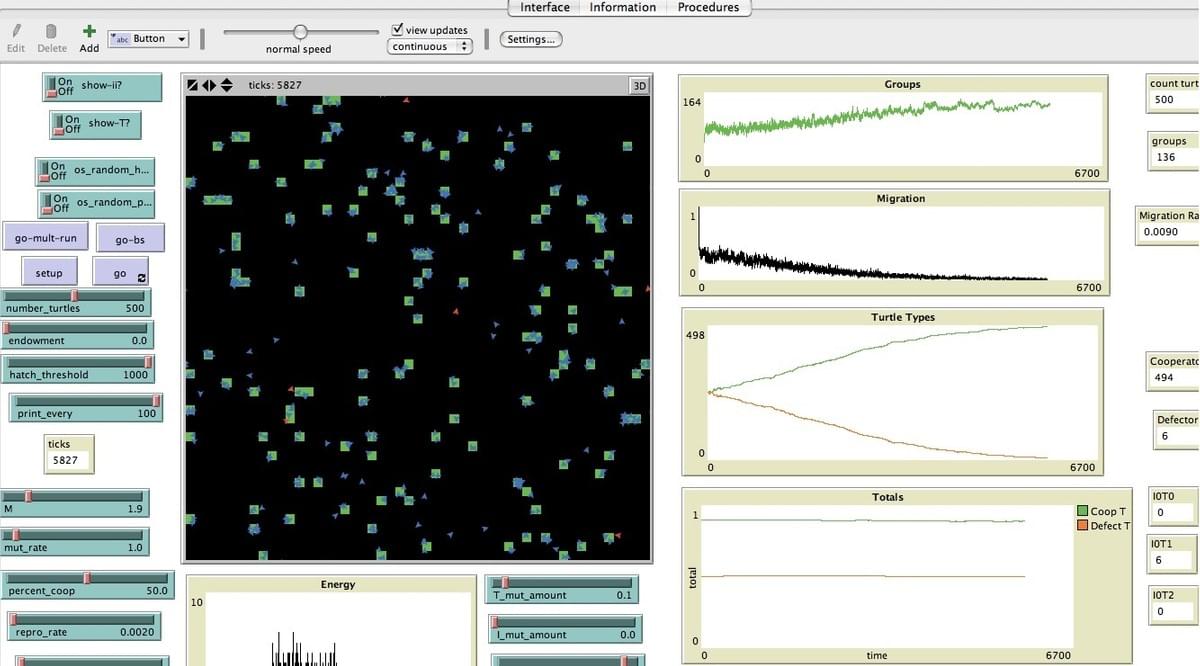
Once you download Netlogo 4.1 and open the model, you'll see a user interface that looks something like this. The two most important buttons are 'setup' and 'go.' With just those two buttons you can watch the model running and see how the proportion of cooperators and defectors change over time. If you want to try other variations, you can change the initial percentage cooperators by changing the 'percent_coop' sliders or changing the multiplier for the public goods games (i.e., how high the payoff is for cooperation) by moving the 'M' slider.
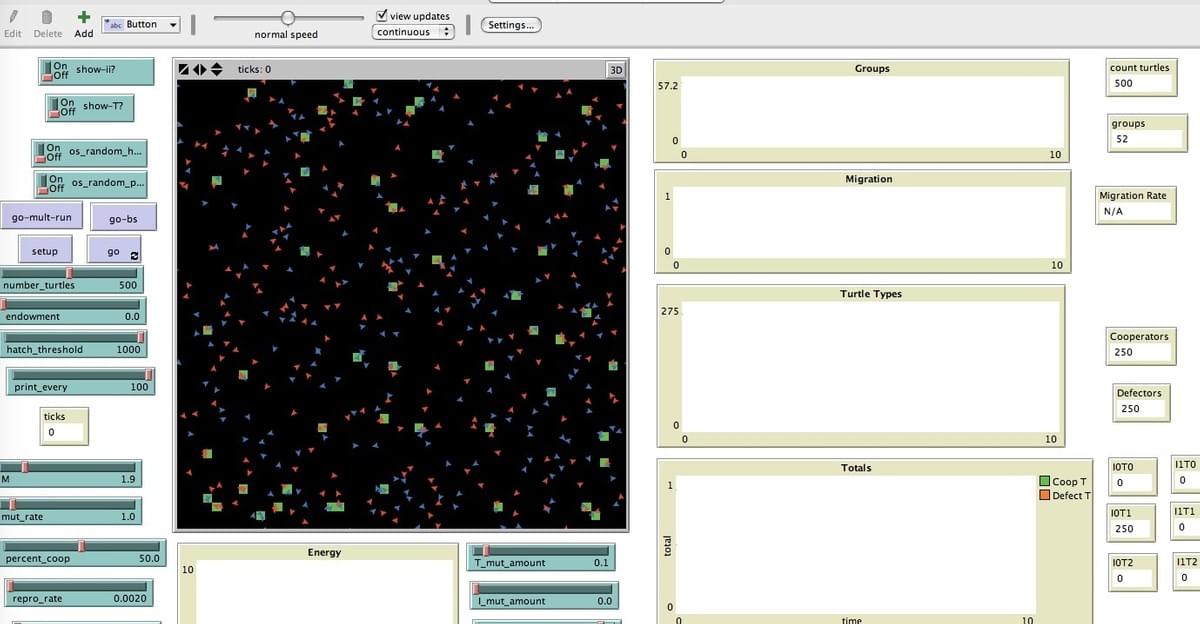
Other things you can change that might not be totally obvious at first are the thresholds that cooperators (I1_initial_T) and defectors (I0_initial_T) use for deciding when to Walk Away. These thresholds describe the proportion of cooperators required for agents to stay in a group. If the threshold is high, agents require high levels of cooperation to stay, if the threshold is low, agents tolerate more defection. You can also explore how the threshold (T) and level of cooperation (I) change if you let them evolve by altering T_mut_amount and I_mut_amount, respectively. You can look at various outputs including the number of groups, migration rate, number of agents of each type and the thresholds of the agents. These are all outputted in the charts on the right side of the model screen shot below.
When I first designed this model, I planned to run simulations looking at many of these variations in follow ups to the initial paper, but then I ended up spending about 5 years trying to get the first paper on the model published - and I haven't yet gotten back to it. If you're interested in reading the paper and learning about what I found, you can download the paper below (from the journal Evolution and Human Behavior).
Are you interested in exploring the role of the Walk Away strategy in the evolution of cooperation? I encourage you to download my models, experiment with them, add new parameters or strategies, and let me know what you find. I'm always open to collaborating if you want to work with me on Walk Away, and also happy to lend my thoughts to your own independent work to extend Walk Away. Happy coding!
